by George Wilken
Manufacturers around the world are always looking to improve operational efficiency and use data gathered from the shop floor to drive improvements. We can discuss lean concepts and the nuances that typically come up in discussions with my lean peers. I can hear “the pencil and an A3 size paper is all we need”, our goal as lean professionals is to understand the business case, current condition, define the root cause and take swift action to ensure the problem has been solved to root with leading indicators. Done correctly, we drive significant improvements to the bottom line. This article presupposes the business case and current condition warrants machine monitoring to drive throughput or quality improvement initiatives. I will document how a Weintek cMT-3072 running Codesys soft PLC and Tulip work together to create a machine monitoring interface that is interactive, data aware and captures information to pareto both loses and defects to support our lean initiatives.
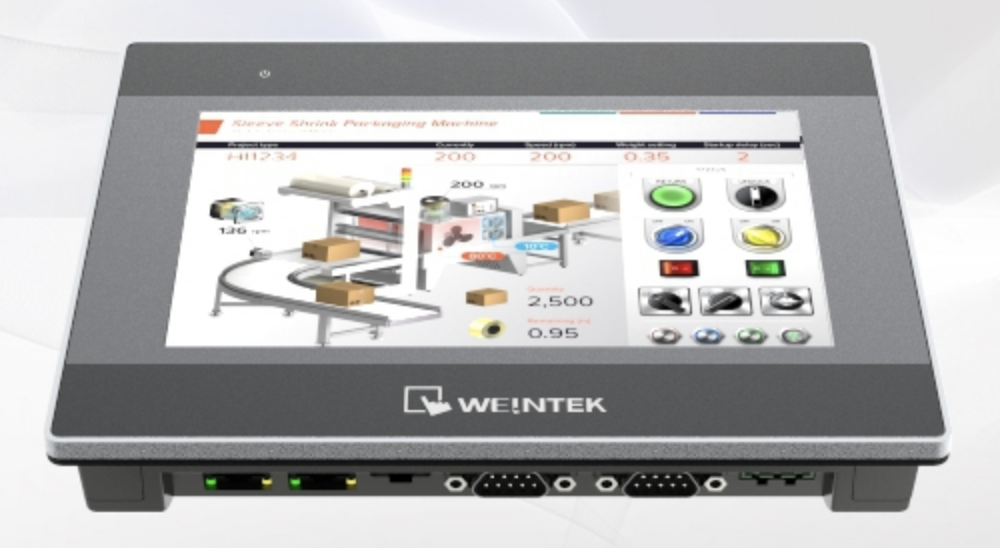
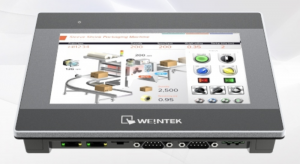 This is not intended to be a step by step tutorial, but a high level introduction of the elements involved and how you can apply the same concepts to your organization. Hardware involved is the Weintek cMT-3072 with CODESYS this is our PLC and HMI in one beautiful form factor.
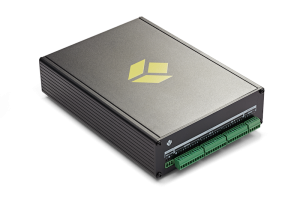
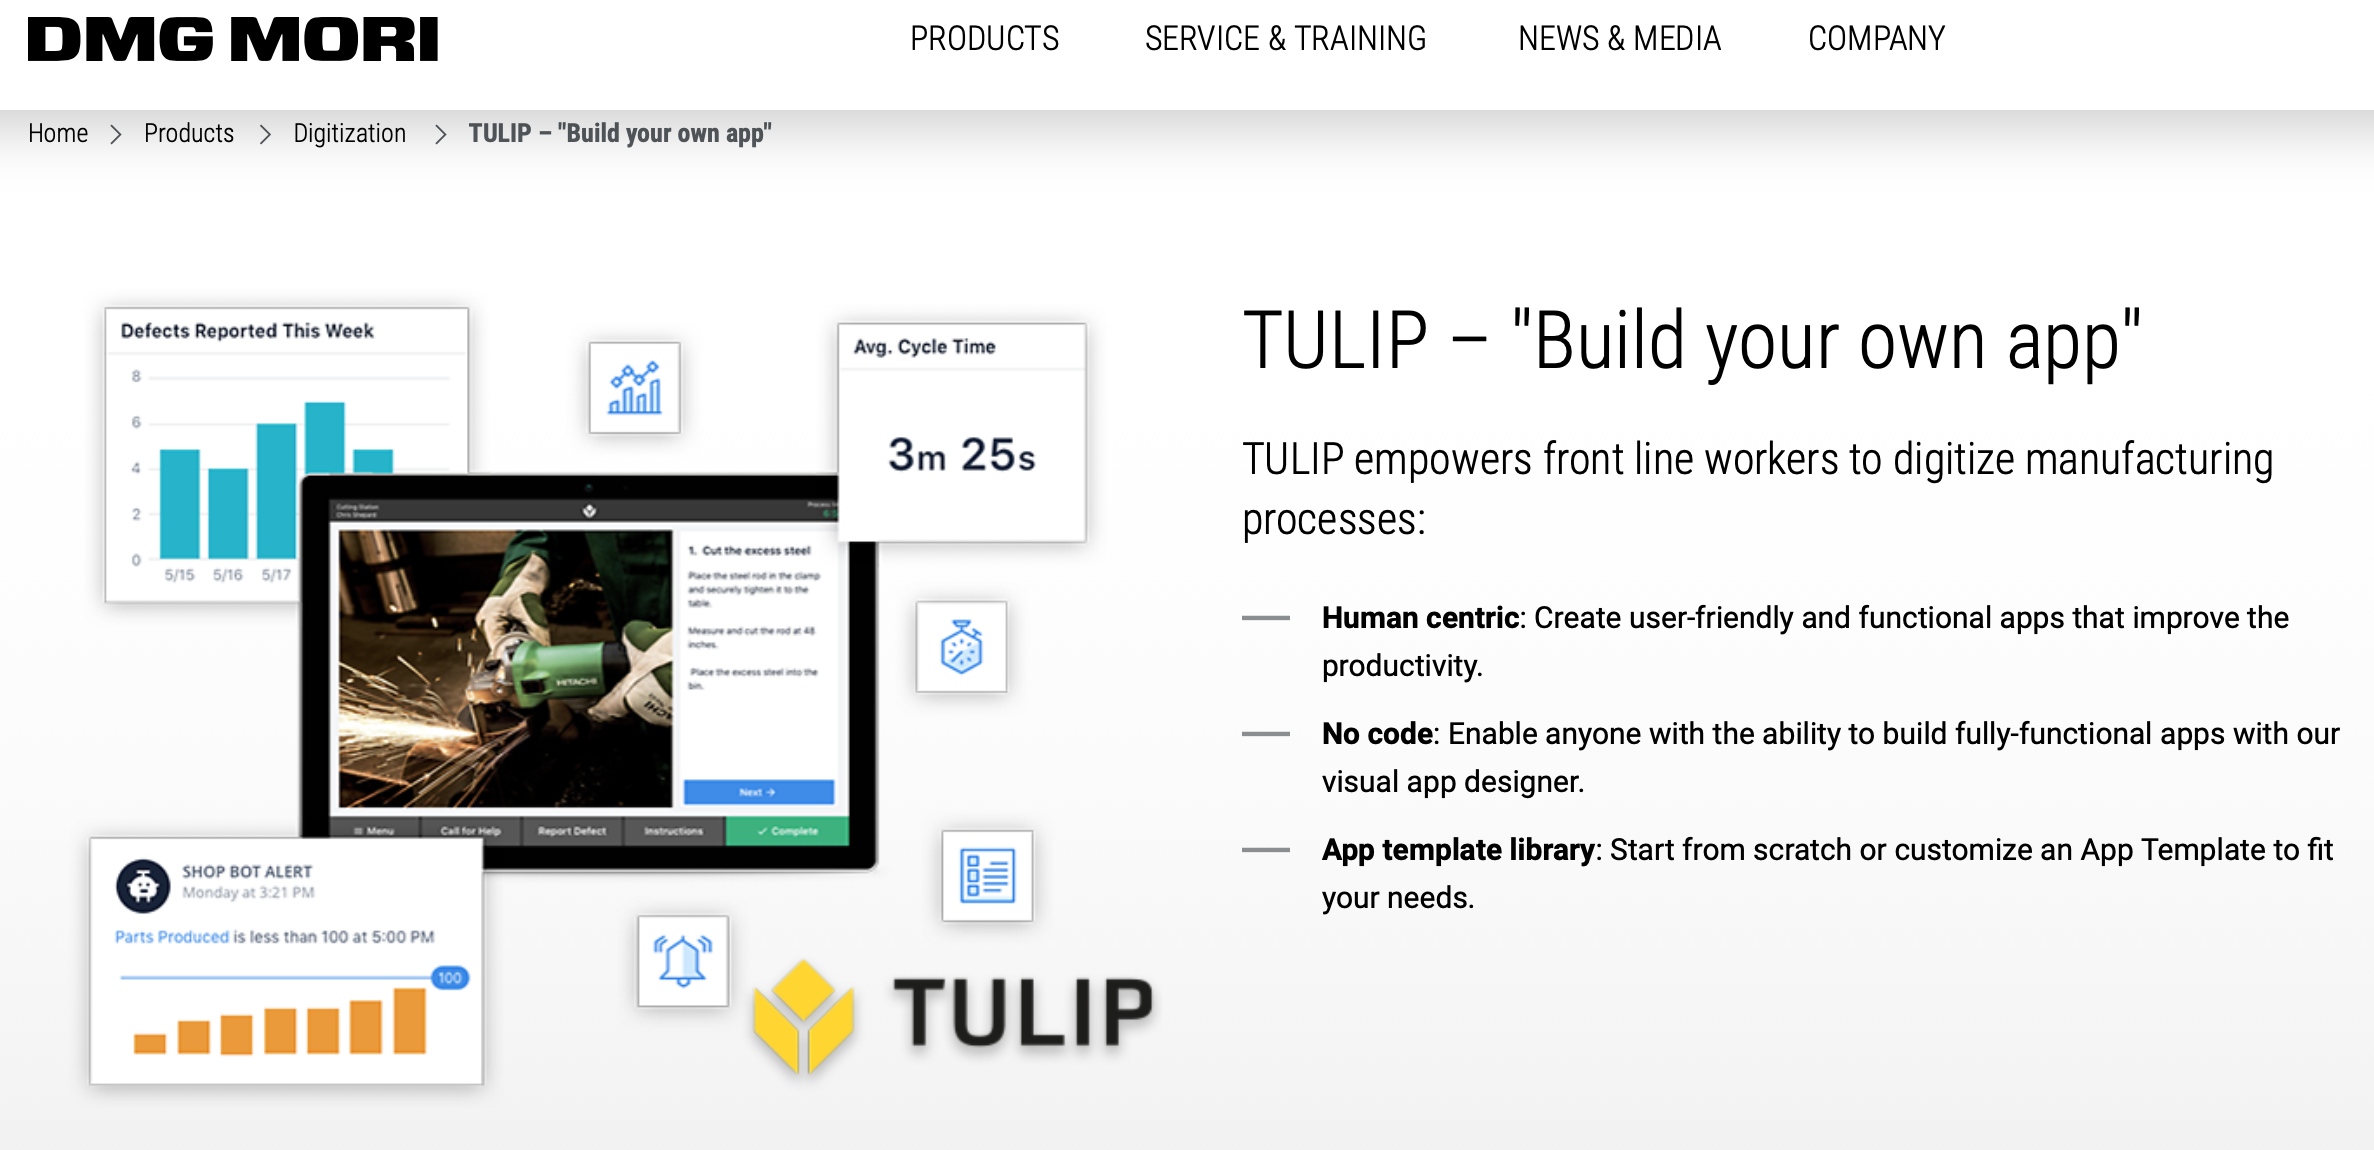
We are using the Tulip.co platform and will need to copy a machine monitoring app from the library or create our own. For WESTEC 2019 we used the Tulip IoT gateway in conjunction with their cloud connector to get tag data from the OPC-UA server running on the cMT-3072 to turn on andon lights when the machine controlled by our PLC starts and stops running.
The IoT gateway from Tulip.co can be used to get I/O from your PLC, or other sensors as well as use logic from the Tulip platform to interact with other devices. See the link above for full specifications.
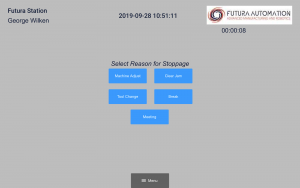
 In this use case example we will use the Weintek HMI to publish via OPC-UA the Optimal Machine Cycle Time (OMCT) which is used for efficiency measurements. Defects are counted on the fly and that data is used to drive the analytics. With the use of the running tag, we can use a trigger to determine when the machine is running and when it is not. While it is running we can capture defects. This is typical of a machining process, where adjustments are made on the fly and if there is a defect it is classified. We must also capture reason codes for the stoppages, along with Operation Number and Work Order. Here is a great article from Tulip on how to plan a machine monitoring app.
- Tags needed from Weintek device:
- Running – Boolean
- Count – Integer
- Part Number – Integer
- Cycle Time – 16 bit unsigned
(names in screenshot don’t match example)
Using the EasyBuilder Pro software available free from Weintek, open the IIoT / Energy tab and then click on OPC-UA. Here is a link to a video that will help you with setting up and configuring your OPC-UA server within EasyBuilder Pro. It is important that you have this step completed first, as this is how we will access the tag data in our Tulip machine monitoring app.
- Key take away from here is know the IP address of your OPC-UA server.
- You will be accessing this data from the Tulip cloud connector and you will need to take two more steps in ensuring connectivity
- On your router, use port forwarding to forward port 4840 from any external IP (we can whitelist a range, but let’s keep it simple) to the IP address of your OPC-UA server, which is the IP of your Weintek HMI.
- Note your external IPV4 address this often available on your router or you can find it by going to https://www.whatismyip.com/ for reference later when creating your connector.
- You will be accessing this data from the Tulip cloud connector and you will need to take two more steps in ensuring connectivity
- Key take away from here is know the IP address of your OPC-UA server.
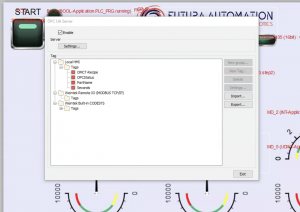
- If you are using CODESYS on your HMI and exposing your tag data, please make sure you have selected them in the codesys program under the “Symbol Configuration” tab. Click the “Settings” button and verify “support OPC-UA features” is checked. This will make your tags in your PLC program available on the OPC-UA server tree.
- Note: You can also expose your I/O to OPC-UA
Once all of the tag data is defined, we will start connecting with Tulip.
- Start by browsing to your Tulip domain
- Choose “Shop Floor” tab
- Choose “Machines”
- I recommend going to “Connectors” and creating a new connector first thing. This is where you will use your external IP address you noted earlier. Tulip has great resources here to help you with all the details of setting up your first machine monitoring app.
- Once your machine connector is working and saved, we can then create the machine.
- Creating the machine requires selecting the connector you just created and the station.
- Now it is time to map tags and create fields to map them to.
- Browsing the OPC-UA tag tree may be confusing initially but it works well. Again, this link from Tulip is a very comprehensive resource.
Now that the machine and connections with tags have been completed we can use that to start building our app. I believe you should use this document to guide you through your first machine monitoring app.
I want to leave you to work this out on your own, but note some of the tasks required to meet the objective below.
Triggers:
- Use the machine count or upon change to count up or down variables.
- Use the machine running boolean to detect when the machine is or is not running.
- Use a timer with logic to prompt for the reason code when the machine is stopped for a significant interval (you define significant)
- Use forms to capture details around the stoppage
- Use forms to capture defects
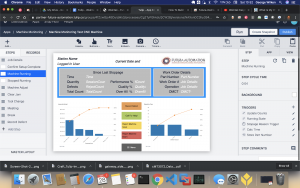
I have included screen shots of the working demo we used at Westec 2019 so you can get an idea of the triggers, steps and forms used.
Analytics, the charts used in the screen shots are using the application data and feeding the analytics. I recommend you follow this guide from Tulip on how to embed analytics. Here is a link to Tulip’s Analytics 101 course.
You can sign up for your free trial of the Tulip platform here.
Written by George Wilken
© PCG, LLC 2019

Recent Comments